Orchard and Packhouse Solar Nelson Tasman: Size it to the quiet months, not the harvest
The short answer
Solar suits a Nelson Tasman packhouse or coolstore sized to its December and January load, not the harvest: on a typical 10 degree roof, February to May gets 31 percent of an array's year. Network Tasman's lines charges are low, so the saving is mostly your energy rate. At 16 cents a kWh our 86 kW worked example pays back in 7.5 to 10 years; at the calculator's 20.4 to 25.5 cents, 5 to 8.5 years.
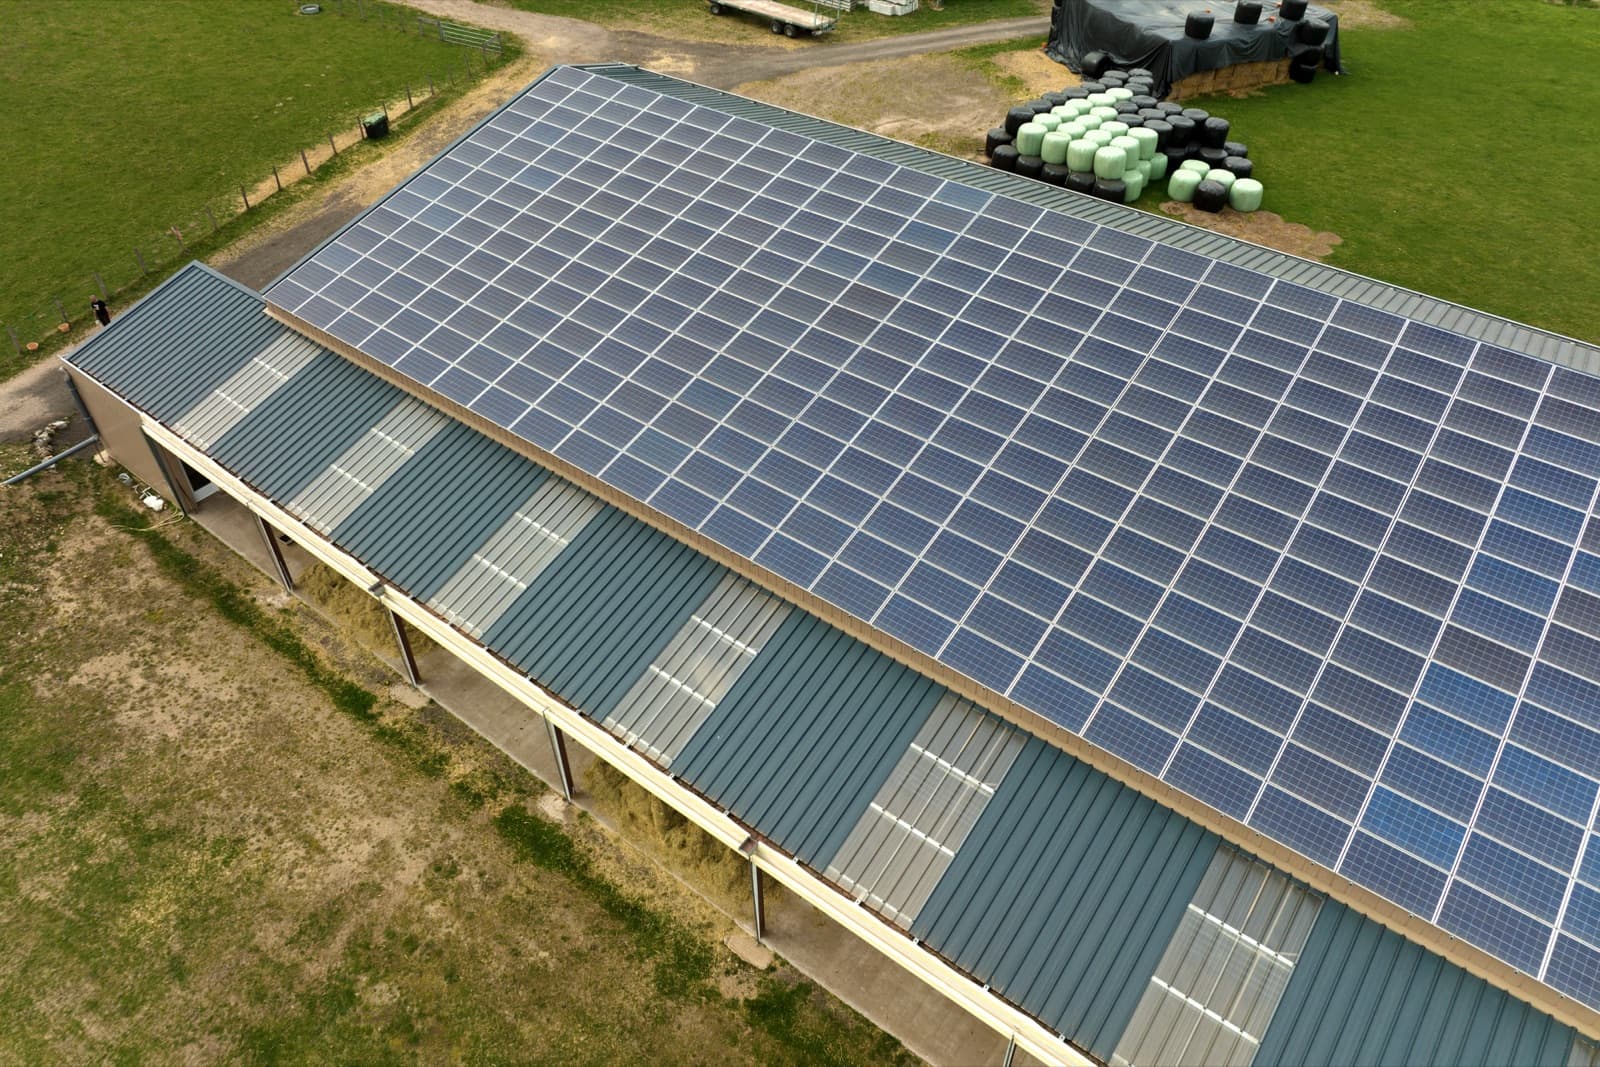
Tasman grows 23 percent of New Zealand's apples by planted area and 38 percent of its pears (Stats NZ), and most of that fruit goes through a packhouse and a coolstore. Refrigeration is the big load, up to 85 percent of a coolstore's energy use (EECA). The catch for solar is timing: the harvest runs from February to mid May and the stores run down by early summer, so a packhouse is busiest when the sun is lower and quietest when it is highest.
We are not an installer. Involve Energy models the system against your own load, arranges the financing stack and project-manages SEANZ-certified local crews through to commissioning, so you own the asset with an independent model behind it and one point of accountability.
The apple year against the solar year
On a typical 10 degree packhouse roof, the harvest months from February to May get 31 percent of a Nelson array's year and November to January 36 percent. Tilting the panels to 39 degrees on frames evens the year out (33 percent and 30 percent), at the cost of the frames and wider row spacing.
| Month | Share of the year at 10 degrees | Share of the year at 39 degrees | The Tasman apple year |
|---|---|---|---|
| January | 12.5% | 10.3% | Before harvest |
| February | 10.0% | 8.9% | Harvest starts |
| March | 9.2% | 9.3% | Harvest |
| April | 6.6% | 7.7% | Harvest |
| May | 5.1% | 6.8% | Harvest ends |
| June | 3.8% | 5.6% | Packing from store |
| July | 4.5% | 6.3% | Packing from store |
| August | 6.1% | 7.5% | Packing from store |
| September | 8.0% | 8.6% | Packing from store |
| October | 10.5% | 9.8% | Packing from store |
| November | 11.6% | 9.7% | Stores run down |
| December | 12.0% | 9.6% | Stores run down |
That sets the size. An array whose December output fits under what the site draws on December days uses most of its power in every month; one sized to the harvest exports much of its summer output for a low buy-back rate. A feasibility study models it month by month against twelve months of your bills, so the quiet months are priced in rather than averaged away.
What solar saves on Network Tasman
Network Tasman's lines charges are low, and its discount, credited through your retailer twice a year, is paid on the electricity you take from the network, so a kWh from your panels saves the charge but forgoes its discount. Weighted by when a Nelson array generates, solar saves about 3.3 cents a kWh of lines charges on a 20 to 150 kVA connection (T-2) and 2 to 2.5 cents over 150 kVA (T-3.4), where days from October to April cost 0.56 cents. In Nelson city, on the former Nelson Electricity network that amalgamated with Network Tasman on 31 March 2026, a 20 to 150 kVA connection pays 4.5 cents on weekdays and 1.7 cents at weekends, with no discount.
| Connection | When | Lines charge per kWh | Discount credited back | A solar kWh saves | Share of the year's output |
|---|---|---|---|---|---|
| T-2, 20 to 150 kVA (Tasman network) | Weekdays, 7am to 11pm | 8.56c | 4.34c | 4.22c | 71% |
| T-2, 20 to 150 kVA (Tasman network) | Weekends | 1.94c | 0.94c | 1.00c | 29% |
| T-3.4, over 150 kVA (Tasman network) | Days, May to September | 8.35c | 2.07c | 6.28c | 28% |
| T-3.4, over 150 kVA (Tasman network) | Days, October to April | 0.56c | 0.14c | 0.42c | 72% |
So the saving per kWh is mostly your energy rate, which your retailer sets and your bill shows. Nationally, MBIE puts the average price, lines and fixed charges included, at 17.7 cents a kWh for food processing and 25.5 cents for commercial customers in the year to March 2026. Our calculator values solar used on site at 20.4 to 25.5 cents, the commercial average and that average less a fifth for fixed charges; on Network Tasman fewer of those cents are lines charges, so the table below prices the worked example from 16 to 28 cents. It assumes power used across the day, because refrigeration runs around the clock.
How it works
01
Feasibility
Send twelve months of power bills, ideally half-hourly data. We model system size, generation against your actual load, self-consumption, cost, savings and payback on your numbers, not industry averages.
02
Financing
We apply the Investment Boost deduction and match the remainder to the best available green or interest-free business lending, sized so the repayment sits at or below your current bill wherever the numbers support it.
03
Installation
Certified local crews install and commission the system on the packhouse or coolstore roof, or on frames alongside. We manage the Network Tasman connection approval, the electrical certification and the programme around your harvest so packing and the cold chain are never at risk.
04
Monitoring
Once live, we watch performance, flag anything underperforming and report your actual savings against the model, year after year.
Start from the worked example below, then send a year of bills for the month by month version. The wider picture is in our cold store and packhouse guide, alongside our pages for Central Otago orchards and packhouses and Canterbury cold stores.
The numbers
What the numbers look like
| Each kWh used on site saves | Annual saving, 86 kW | Payback after the Investment Boost |
|---|---|---|
| 16 cents | $15,600 | 7.5 to 10 years |
| 20 cents | $18,800 | 6.5 to 8.5 years |
| 24 cents | $22,000 | 5.5 to 7 years |
| 28 cents | $25,200 | 5 to 6.5 years |
Cited references
Worked examples from real sites
Industry referenceRichmond, Nelson
Lineage Logistics
Feisst Electrical and NuGreen Solutions installed about 1,000 solar panels across the roof of Lineage Logistics' cold storage facility in Richmond, Nelson, the installer's second project for Lineage. No system size, output or savings have been published. A cited industry reference from the installer's SEANZ member case study, July 2025, not an Involve Energy project.
Your numbers
Start from the example. Put in yours.
Your farm or business
Your indicative numbers
Conservative, ex GST, modelled not promised
Measure
- Power used
- 282,353 kWh a year
- Your spend at 25.5c a kWh ex GST, the national commercial average.
- Power bill
- $72,000 a year
Design
- System
- 86 kW
- Sized to your daytime load.
- Generates
- 114,380 kWh a year
- Used on site
- 70%
- The rest exports at 8c a kWh.
- Installed cost
- $127,280 to $168,560
- Confirmed with certified installers.
Finance
- Investment Boost, year one
- about $8,284
- A 20% immediate tax deduction, worth this in cash at the 28% company rate. Not a discount.
- ASB Smart Solar Loan
- $2,465 a month
- 0% for 5 years. Reverts to a floating business rate after five years. Terms checked against asb.co.nz on 8 October 2026. ASB may change or withdraw the offer; the calculator only shows it while it matches.
- Estimated saving
- $1,760 a month
- Mid estimate, set against the repayment while the loan runs.
Outcome
- Saving
- $19,079 to $23,162 a year
- Payback
- 5 to 8.5 years
- Net of the Investment Boost benefit.
- Emissions avoided
- 5.9 t CO₂e a year
- Asset life
- 25+ years
- Panels keep producing long after payback.
How this is modelled (assumptions v2026-10-v7)
- Power valued at $0.20 to $0.26/kWh ex GST (savings are never valued at the top of the commercial tariff range).
- Export credited at $0.08/kWh, the conservative end of current buy-back rates.
- Installed cost interpolated from 30 kW ($1,800 to $2,600/kW) down to 500 kW ($1,100 to $1,500/kW), 2025/26 working ranges.
- Nelson and Tasman yield modelled at 1330 kWh per kW per year.
- Self-consumption capped by your daytime usage profile and held below typical vendor claims; sizing targets 90 percent of daytime load.
- Investment Boost stated as the year-one cash value of the 20 percent immediate deduction at the 28 percent company rate. It is a tax timing benefit, not a discount.
- No power price escalation and no panel degradation in simple payback; omitting escalation outweighs degradation, so the net effect is conservative.
Indicative only; not financial or tax advice. The feasibility study models your site from twelve months of actual bills.
Next step
Get these numbers checked properly
The real model is built from twelve months of your bills. Send your details and we will do it for you; we reply within one working day, no obligation.
Straight answers
The questions we get asked
Is solar worth it for a Nelson Tasman packhouse or coolstore?
It can be, if it is sized to what the site uses in December and January rather than at harvest. Refrigeration is the big load, up to 85 percent of a coolstore's energy (EECA), and on Network Tasman the saving is mostly your energy rate. Our 86 kW worked example pays back in 6.5 to 8.5 years if solar saves 20 cents a kWh, and 5 to 6.5 years at 28 cents. EECA's June 2025 technology scan puts typical packhouse savings at 5 to 15 percent of electricity costs.
Why does the apple calendar matter for solar?
Because the busy months are not the sunny ones. The Tasman harvest runs from early February to mid May, and coolstores hold fruit until a couple of months before the next harvest. On a typical 10 degree packhouse roof, an array makes 31 percent of its year from February to May and 36 percent from November to January, when the stores are running down. Size the array so its summer output fits under the site's summer load.
What does solar save in lines charges on Network Tasman?
Not much. Network Tasman's lines charges are low, and its discount is paid on the electricity you take from the network, so a kWh from your panels saves the lines charge but forgoes its discount. On a 20 to 150 kVA connection (T-2) that is 4.22 cents a kWh on weekdays and 1 cent at weekends; over 150 kVA (T-3.4), 6.28 cents on winter days and 0.42 cents from October to April. Most of the saving is your energy rate.
Does Network Tasman pay for exported solar?
No. Business connections on Network Tasman pay nothing and receive nothing from the network for exported generation, on both the Tasman and Nelson networks. What exported power earns comes from your retailer's buy-back rate, which we model at 8 cents a kWh. That is why we size to the load the site uses rather than to the roof.
Is Nelson the sunniest place in New Zealand?
Not on the record. NIWA's annual climate summaries put Richmond second in each of the last three years, behind Lake Tekapo in 2023, Blenheim in 2024 and New Plymouth in 2025. What matters for solar is output: on PVGIS data a north-facing array in Nelson makes 1,336 kWh per kW a year after our derate, against 1,388 in Blenheim, and we model Nelson Tasman at 1,330.
See your packhouse's year, month by month
Send twelve months of power bills and we will model generation against your load month by month, at the per-kWh charges on your own bills. Independent, no obligation, yours to keep.