Dairy Farm Solar Otago: Solar sized to your daytime farm loads, on coastal Otago sun
The short answer
Solar pays on coastal Otago dairy farms with daytime load: irrigation and effluent pumping, milk chilling and water heating, not the pre-dawn milking peak. We model the region's real yield of about 1,220 kWh per kW a year; a typical 30 kW shed system costs $54,000 to $78,000 installed in 2026, before the Investment Boost deduction.
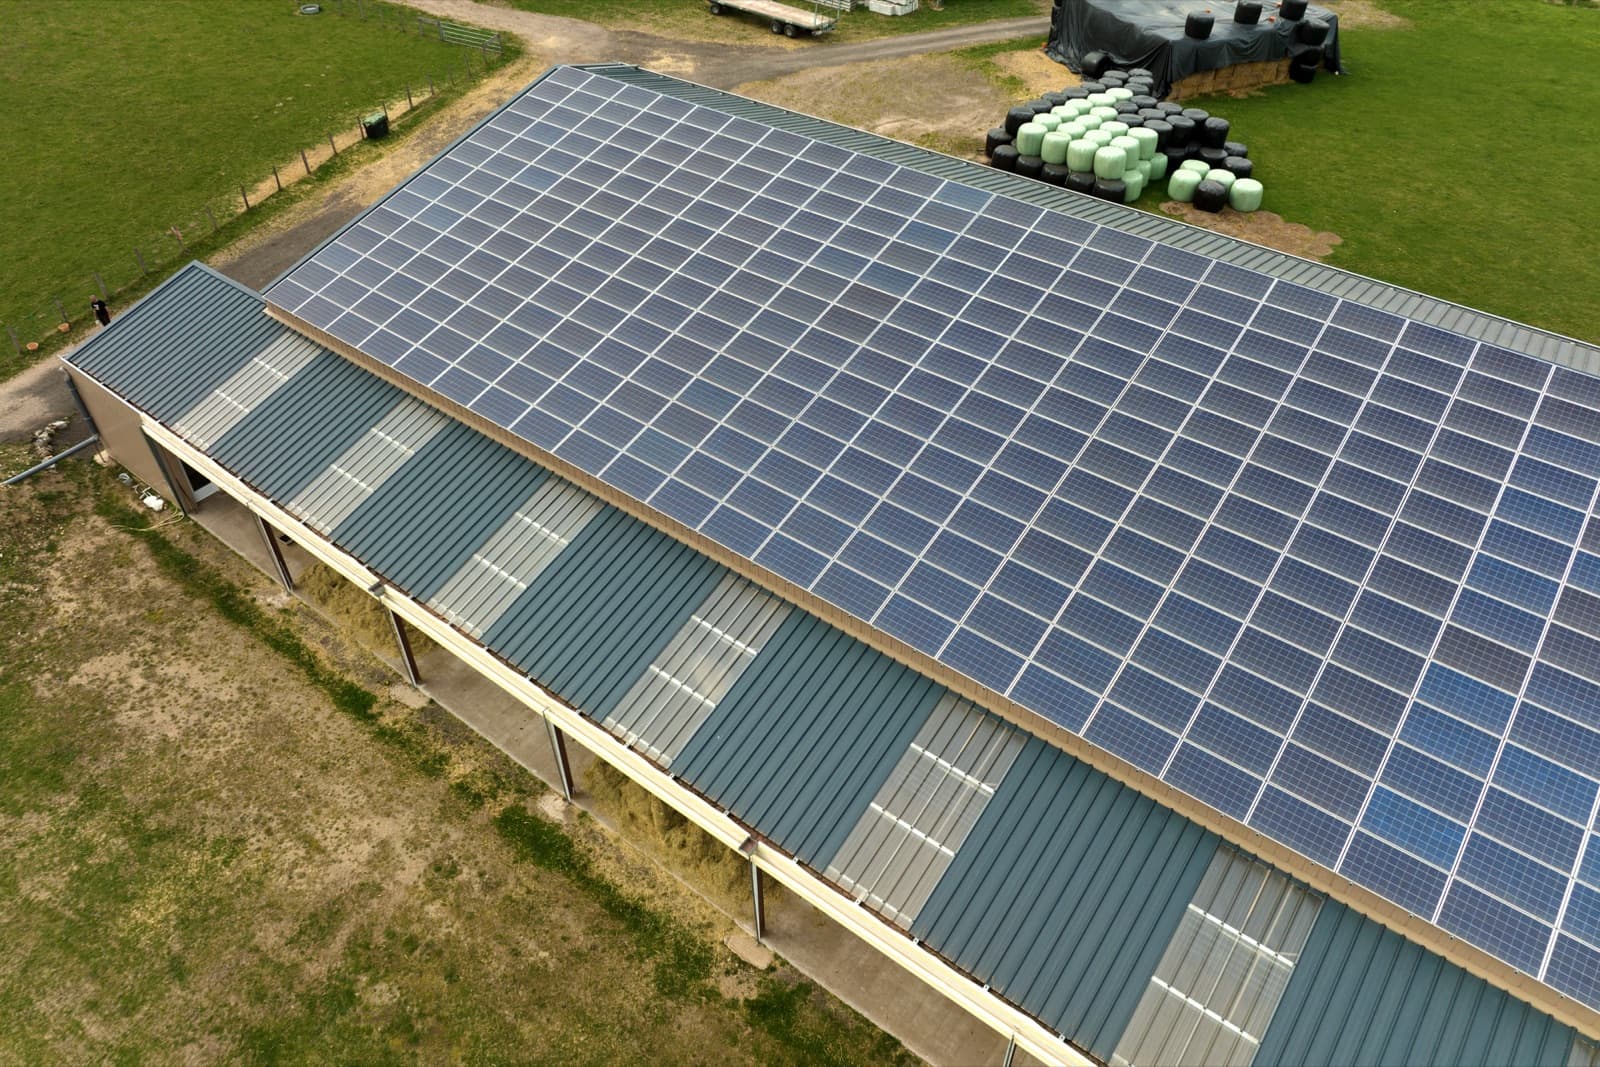
Coastal and South Otago carry a substantial dairy herd, and these farms run the daytime loads that make solar work: irrigation and effluent pumping, milk chilling and water heating. Milking peaks before dawn, so the honest case is built on those all-day loads, and coastal Otago's rising power cost does the rest.
We are not an installer. Involve Energy models the system against your own bills, arranges the financing stack and project-manages SEANZ-certified local crews through to commissioning, so you get an owned asset, an independent model and one point of accountability.
Coastal Otago sun, modelled honestly
We model coastal Otago at around 1,220 kWh per kilowatt a year, averaged from satellite data for Dunedin, Oamaru and Balclutha and derated for real installs. What matters is that generation and your heavy daytime loads rise and fall together through the season, and the comparison table below uses the coastal yield.
The full dairy picture, including the pre-dawn milking caveat, is in our guide to solar for dairy farms.
How it works
01
Feasibility
Send twelve months of power bills, ideally half-hourly data. We model system size, generation against your actual load, self-consumption, cost, savings and payback on your numbers, not industry averages.
02
Financing
We apply the Investment Boost deduction and match the remainder to the best available green or interest-free business lending, sized so the repayment sits at or below your current bill wherever the numbers support it.
03
Installation
Certified local crews install and commission the system. We manage the lines company approval, the electrical certification and the programme around your milking and effluent calendar.
04
Monitoring
Once live, we watch performance, flag anything underperforming and report your actual savings against the model, year after year.
The numbers
What the numbers look like
| System size | Indicative installed cost | Indicative annual saving | Indicative payback |
|---|---|---|---|
| 30 kW | $54,000 to $78,000 | $6,000 to $7,000 | 7 to 12 years |
| 60 kW | $98,000 to $135,000 | $12,000 to $15,000 | 6 to 10.5 years |
| 100 kW | $140,000 to $180,000 | $20,000 to $25,000 | 5.5 to 8.5 years |
| 250 kW | $275,000 to $375,000 | $51,000 to $62,000 | 4 to 7 years |
Cited references
Worked examples from real sites
Industry referenceFeatherston, Wairarapa
Kaiwaiwai Dairies
Kaiwaiwai Dairies in the Wairarapa installed a 54 kW ground-mounted array in 2021 for about $110,000; it saves $17,000 to $20,000 a year, a five and a half to six and a half year payback. More than 90 percent of generation is used on site across irrigation, effluent and chilling; export income is only about $267 a year. The farm is now an EECA Solar on Farms demonstration site, listed in May 2026 at 288 kW with batteries. Figures as published by EECA.
- System
- 54 kW
- Installed cost
- $110,000
- Annual saving
- $18,500
- Payback
- 6 years
Source: EECA case study
Your numbers
Start from the example. Put in yours.
Your farm or business
Your indicative numbers
Conservative, ex GST, modelled not promised
Measure
- Power used
- 164,706 kWh a year
- Your spend at 25.5c a kWh ex GST, the national commercial average.
- Power bill
- $42,000 a year
Design
- System
- 55 kW
- Sized to your daytime load.
- Generates
- 67,100 kWh a year
- Used on site
- 70%
- The rest exports at 8c a kWh.
- Installed cost
- $91,143 to $127,286
- Confirmed with certified installers.
Finance
- Investment Boost, year one
- about $6,116
- A 20% immediate tax deduction, worth this in cash at the 28% company rate. Not a discount.
- ASB Smart Solar Loan
- $1,820 a month
- 0% for 5 years. Reverts to a floating business rate after five years. Terms checked against asb.co.nz on 8 October 2026. ASB may change or withdraw the offer; the calculator only shows it while it matches.
- Estimated saving
- $1,033 a month
- Mid estimate, set against the repayment while the loan runs.
Outcome
- Saving
- $11,192 to $13,588 a year
- Payback
- 6.5 to 10.5 years
- Net of the Investment Boost benefit.
- Emissions avoided
- 3.5 t CO₂e a year
- Asset life
- 25+ years
- Panels keep producing long after payback.
How this is modelled (assumptions v2026-10-v7)
- Power valued at $0.20 to $0.26/kWh ex GST (savings are never valued at the top of the commercial tariff range).
- Export credited at $0.08/kWh, the conservative end of current buy-back rates.
- Installed cost interpolated from 30 kW ($1,800 to $2,600/kW) down to 500 kW ($1,100 to $1,500/kW), 2025/26 working ranges.
- Otago (Dunedin and coastal) yield modelled at 1220 kWh per kW per year.
- Self-consumption capped by your daytime usage profile and held below typical vendor claims; sizing targets 90 percent of daytime load.
- Investment Boost stated as the year-one cash value of the 20 percent immediate deduction at the 28 percent company rate. It is a tax timing benefit, not a discount.
- No power price escalation and no panel degradation in simple payback; omitting escalation outweighs degradation, so the net effect is conservative.
Indicative only; not financial or tax advice. The feasibility study models your site from twelve months of actual bills.
Next step
Get these numbers checked properly
The real model is built from twelve months of your bills. Send your details and we will do it for you; we reply within one working day, no obligation.
Straight answers
The questions we get asked
Is solar worth it for a coastal Otago dairy farm?
On the daytime loads, often. Coastal and South Otago farms carry irrigation and effluent pumping, milk chilling and water heating that run in daylight, and solar pays on those, not the pre-dawn milking peak. We model the region's own yield, about 1,220 kWh per kW a year, and settle it on a half-hourly analysis of your bills.
How much sun does coastal Otago get?
We model coastal Otago and Dunedin at around 1,220 kWh per kW a year, averaged from satellite data for Dunedin, Oamaru and Balclutha and derated for real installs. It is a solid yield for a well-matched daytime load, and the comparison table below uses it, so the numbers are honest for your location.
Which loads does solar offset on the farm?
Effluent and water pumping, milk chilling and refrigeration, water heating on daytime timers, and any workshop, pump shed or dwelling on the same connection. These run through daylight, so a system sized to them uses most of its generation on site, worth 20.4 to 25.5 cents a kWh in our model, rather than exporting at 7 to 17 cents.
How do Otago farmers pay for it?
Most stack the Investment Boost tax deduction with rural green lending. Dated rural offers such as ASB's Smart Solar Loan (0 percent for five years up to $150,000 for rural customers) come and go on bank timetables, so we only ever show what is live on the day you run the numbers.
See your Otago farm's numbers
Send a recent power bill and we will model system size, cost, savings and payback on coastal Otago's real sunshine and your actual usage. Independent, no obligation, yours to keep.